If you want to update this page or add new content, please submit a pull request to the Homepage.
Self-Hosted Server
This page explains how to run your own Yorkie Server.
To run a Yorkie Server, you need to install the CLI. If you haven't installed it yet, please refer to CLI.
Running a Server via CLI
Start a Server with the following command:
$ yorkie serverbackend created: id: cppoq5huevgut6tjo8qg, db: memoryserving RPC on 8080serving profiling on 8081
The Server handles administrative requests such as project maintenance and continues to run until it receives termination commands such as Ctrl+C. The Server stores its data using an in-memory database, which does not provide durability by default.
Persistence
If you start the Server with a MongoDB address, you can permanently save the data stored by Yorkie.
To start MongoDB, docker-compose -f build/docker/docker-compose.yml up --build -d in the project root.
Then, start a Yorkie Server with --mongo-connection-uri flag to connect the MongoDB.
$ yorkie server --mongo-connection-uri mongodb://localhost:27017MongoDB connected, URI: mongodb://localhost:27017, DB: yorkie-metabackend created: id: cppoqe9uevguvlsehcg0, rpc: mongodb://localhost:27017serving profiling on 8081serving RPC on 8080
Monitoring
The Server exports metrics under the /metrics path on its profiling port. Fetch the metrics with curl:
$ curl http://localhost:8081/metricsyorkie_server_version{server_version="{{site.version}}"} 1# HELP yorkie_pushpull_received_changes_total The total count of changes included# TYPE yorkie_pushpull_received_changes_total counteryorkie_pushpull_received_changes_total 6...
These metrics can be collected by Prometheus.
Running Prometheus and Grafana is the easiest way to monitor the Server's metrics.
First, download all manifest files from the docker folder. Then start the applications with docker-compose:
$ docker-compose -f docker-compose-full.yml up --build -dCreating prometheus ... doneCreating grafana ... done
Now, Prometheus will collect Server metrics every 10 seconds.
Grafana has built-in Prometheus support. Add a Prometheus data source:
Name: prometheusType: PrometheusUrl: http://localhost:9090Access: proxy
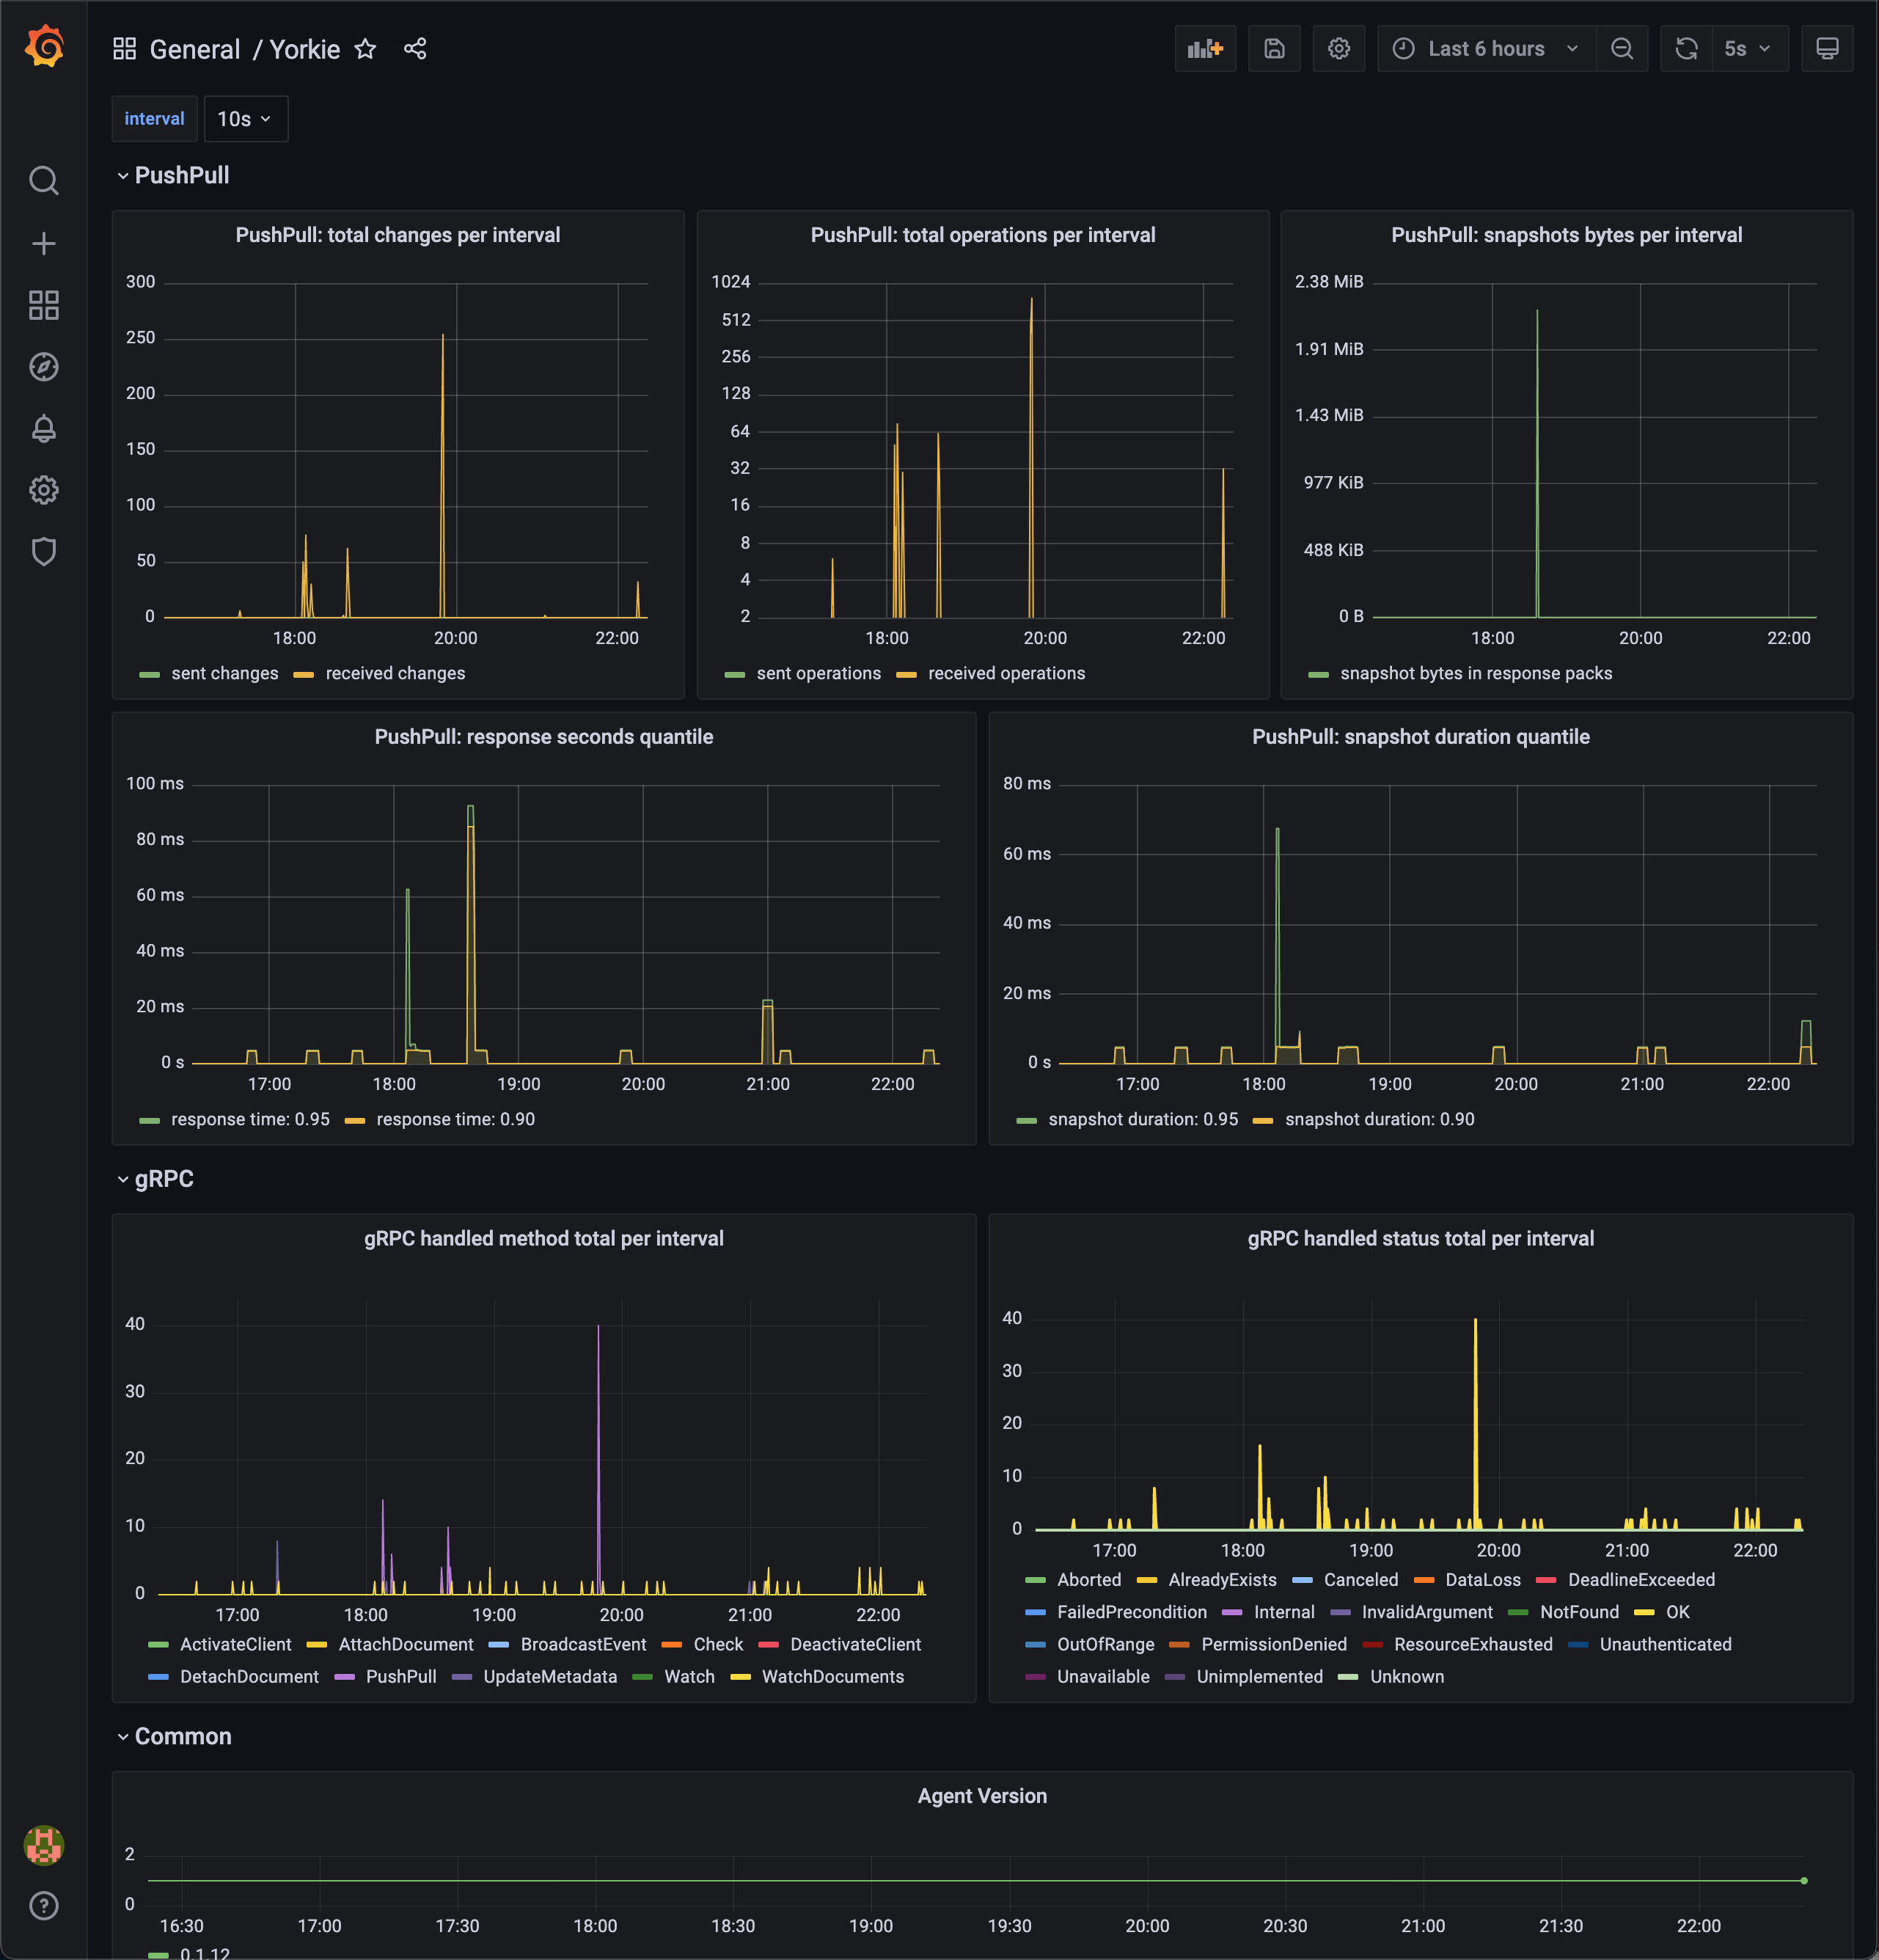
Then, import the default Yorkie dashboard template and customize it. For instance, if Prometheus data source name is my-prometheus, the datasource field values in JSON also need to be my-prometheus.
Sample dashboard:
Sharded Cluster
In a production environment, a server cluster is necessary to handle large workloads while ensuring high availability, reliability, and scalability.
Yorkie provides a sharded cluster in Kubernetes environments to support production environments.
This section describes how to set up a sharded cluster. An example of the sharded cluster architecture:
- L7 Load Balancer: It is responsible for routing requests to servers based on the computed request’s hash key and consistent hashing algorithm.
- Service Registry: It is responsible for storing metadata and configuration settings for Yorkie servers.
- MongoDB: It stores the data of Yorkie. It can be configured to use sharding, just like Yorkie sharded cluster.
Yorkie provides a Helm Chart, a package manager for Kubernetes, to easily deploy a Yorkie cluster on Kubernetes with the above components configured.
Below are guides for deploying Yorkie cluster on Kubernetes with Helm Charts on various platforms.
- Minikube Installation: Guide to install Yorkie cluster on Minikube.
- AWS EKS Installation: Guide to install Yorkie cluster on AWS EKS.
Also, you can additionally deploy Yorkie cluster addons on Kubernetes with Helm Charts on your own environment.
Yorkie cluster addons include:
- Monitoring: Provides Yorkie metrics and logging via Grafana dashboard.
- GitOps: Provides Yorkie Continuous Delivery via ArgoCD.
Below is guide for deploying Yorkie cluster addons on Kubernetes with Helm Charts.
- Cluster Addons Installation: Guide to install Yorkie cluster addons on Kubernetes.