If you want to update this page or add new content, please submit a pull request to the Homepage.
- Prerequisites
- Install Yorkie Monitoring with Helm chart
- View Yorkie Metrics and Loki Logs on Grafana dashboard
- Install ArgoCD with Helm chart
- View Yorkie GitOps on ArgoCD web UI
- Install Yorkie Analytics with Helm chart
- Connect Yorkie cluster to Yorkie analytics
- Connect Yorkie addons to ArgoCD
- Clean up cluster addons
- Next Steps
Cluster Addons Installation
Yorkie provides a set of cluster addons to help you monitor and manage Yorkie cluster.
This guide will walk you through the process of installing Yorkie cluster addons on your Kubernetes cluster.
Currently, Yorkie addons include:
- Prometheus for collecting metrics from Yorkie cluster.
- Grafana for monitoring Yorkie cluster via Grafana dashboard.
- Loki for logging aggregation.
- ArgoCD for managing Yorkie cluster via GitOps.
- Kafka for analytics of usage of Yorkie cluster.
- StarRocks for analytics of usage of Yorkie cluster.
Prerequisites
This guide assumes that you have installed Yorkie cluster on your Kubernetes cluster with Helm chart. If you haven't installed Yorkie cluster, follow guides for deploying Yorkie cluster on Kubernetes with Helm Charts on various platforms.
- Minikube Installation: Guide to install Yorkie cluster on Minikube.
- AWS EKS Installation: Guide to install Yorkie cluster on AWS EKS.
Install Yorkie Monitoring with Helm chart
You can install Yorkie monitoring addon to collect and monitor Yorkie metrics and logs. Yorkie monitoring addons include Prometheus, Grafana, and Loki to collect metrics and logs from Yorkie cluster.
Install Yorkie monitoring addon with the following command:
$ helm install yorkie-monitoring yorkie-team/yorkie-monitoring -n monitoring --create-namespace
If you are using AWS EKS, use the following command instead:
$ helm install yorkie-monitoring yorkie-team/yorkie-monitoring -n monitoring --create-namespace \--set ingress.ingressClassName=alb \--set ingress.hosts.enabled=true \--set ingress.hosts.apiHost={YOUR_API_DOMAIN_NAME} \--set ingress.hosts.alb.enabled=true \--set ingress.alb.certArn={YOUR_CERTIFICATE_ARN}
Replace {YOUR_API_DOMAIN_NAME} with your domain name.
Also, replace {YOUR_CERTIFICATE_ARN} with your certificate ARN.
This will install yorkie-monitoring release.
After Yorkie monitoring is installed, you will see the following output:
NAME: yorkie-monitoringLAST DEPLOYED: Tue May 2 15:13:00 2023NAMESPACE: monitoringSTATUS: deployedREVISION: 1NOTES:--- Install Complete ---yorkie-monitoring successfully installed!For next steps, follow:$ curl https://github.com/yorkie-team/yorkie/tree/main/charts/yorkie-monitoringTo learn more about the release, try:$ helm status yorkie-monitoring -n monitoring$ helm get all yorkie-monitoring -n monitoring
Now you have Yorkie monitoring installed. It will take a few minutes for pods to be ready, so wait until all pods are ready. You can check the status of pods with the following command:
$ kubectl get pods -n monitoring --watch
After all pods are ready, you will see the following output:
NAME READY STATUS RESTARTS AGEprometheus-yorkie-monitoring-prometheus-0 2/2 Running 0 14myorkie-monitoring-grafana-59d4565948-pfstz 3/3 Running 0 14myorkie-monitoring-loki-0 1/1 Running 0 14myorkie-monitoring-operator-78f75648c-rvjk9 1/1 Running 0 14myorkie-monitoring-prometheus-node-exporter-gr4bn 1/1 Running 0 14myorkie-monitoring-promtail-bwc9g 1/1 Running 0 14m
View Yorkie Metrics and Loki Logs on Grafana dashboard
Now you have Yorkie monitoring installed, you can access Grafana dashboard to view Yorkie metrics and Loki logs.
Access Grafana dashboard with following url:
- Minikube: http://
YOUR_MINIKUBE_IP/grafana/ - AWS EKS: http://
YOUR_API_DOMAIN_NAME/grafana/
admin and yorkie.Once you are logged in, you will see the following dashboard:
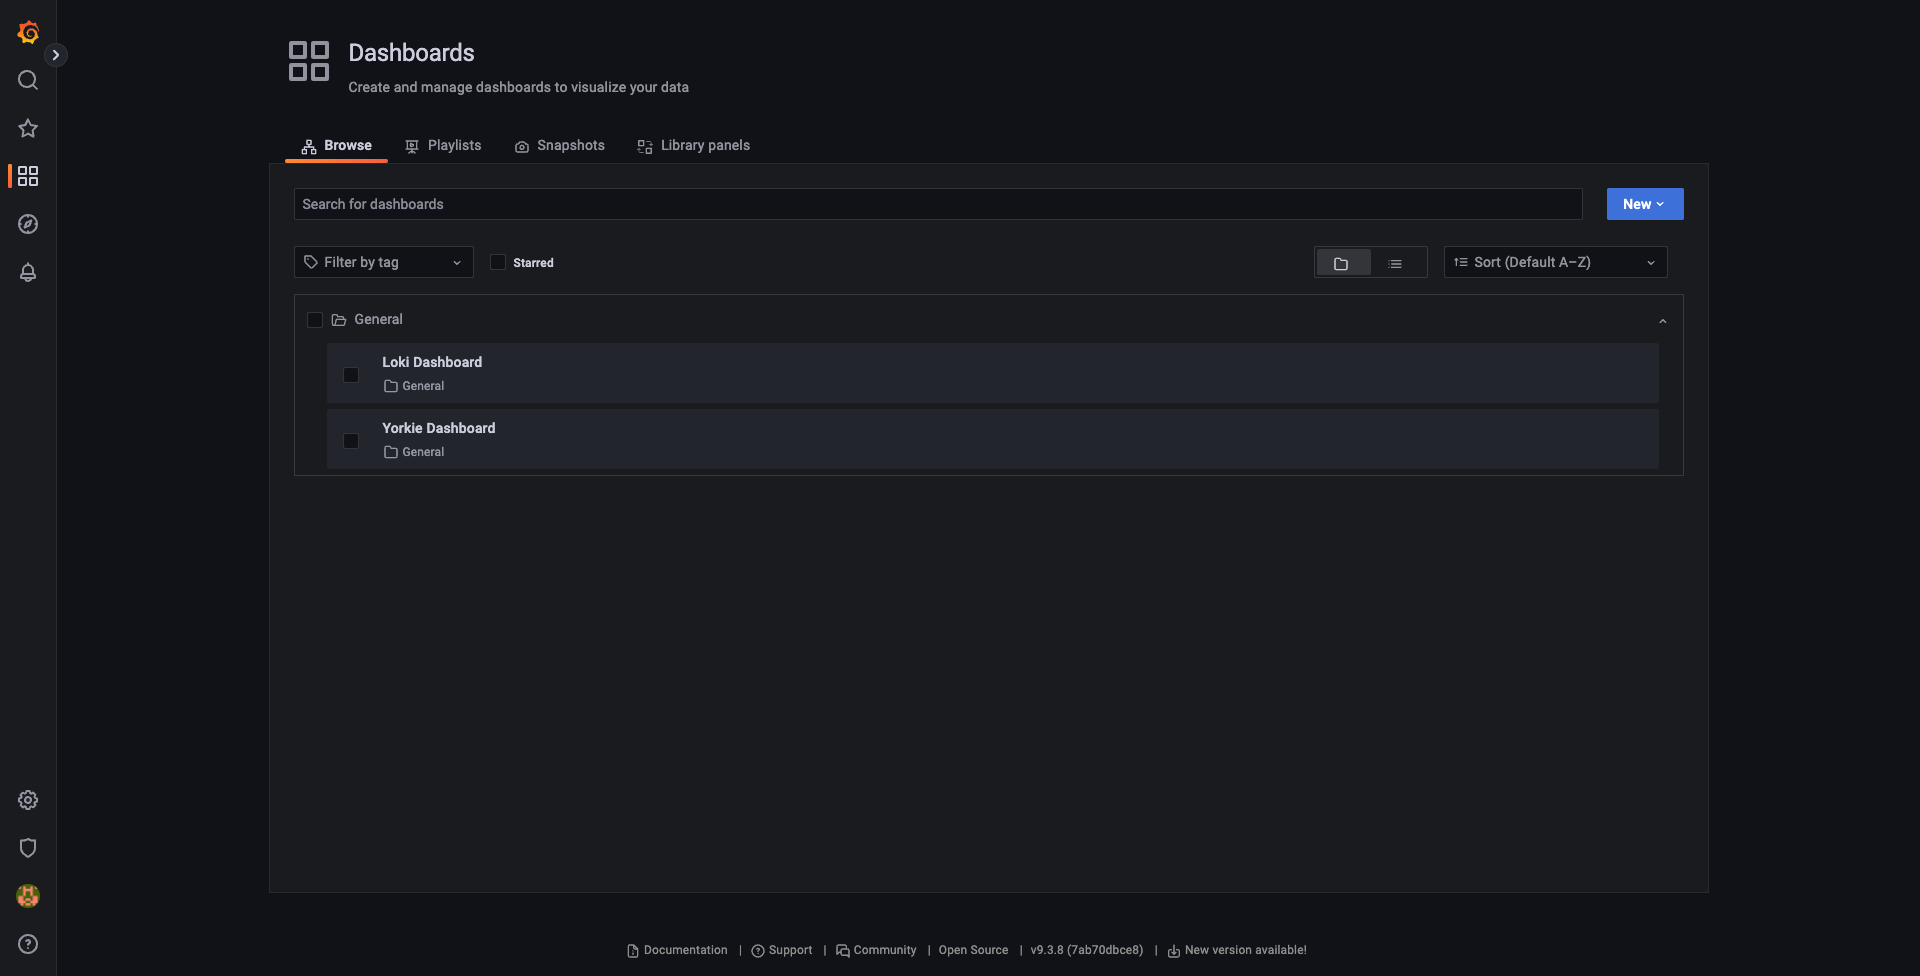
Grafana contains two default dashboards: Loki Dashboard and Yorkie Dashboard
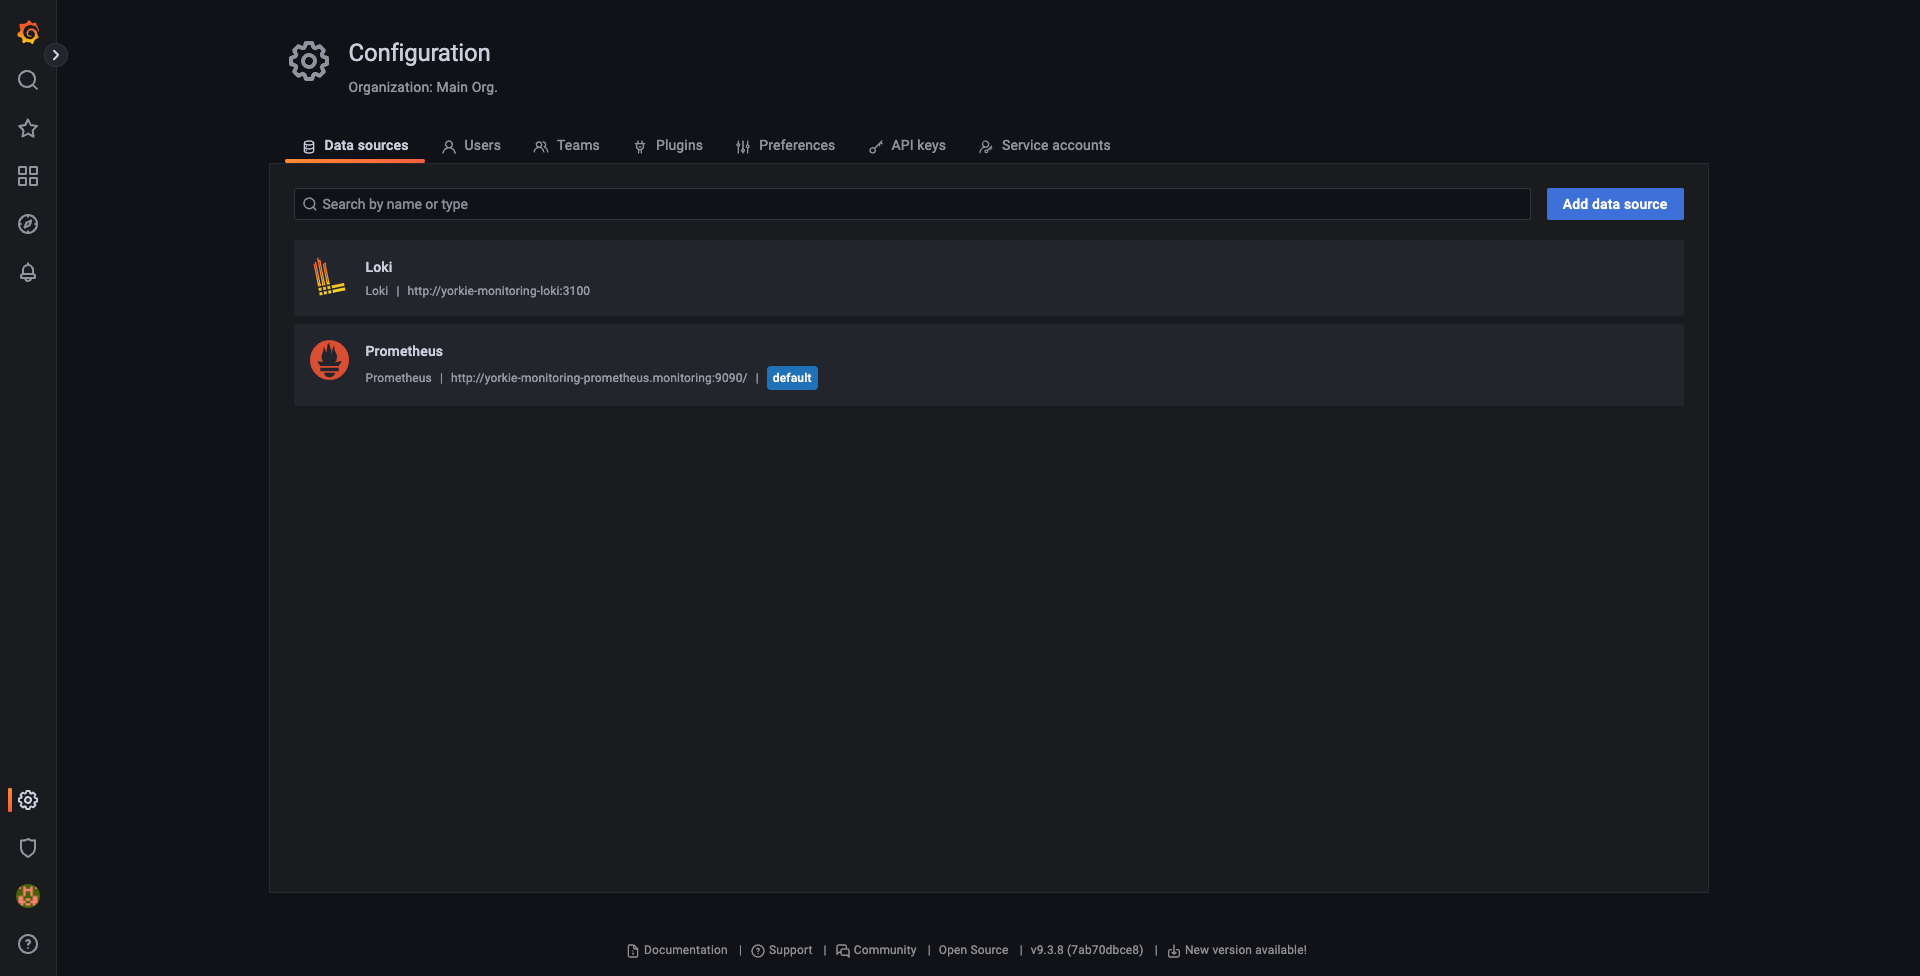
You can see there are two datasources attached: Prometheus and Loki
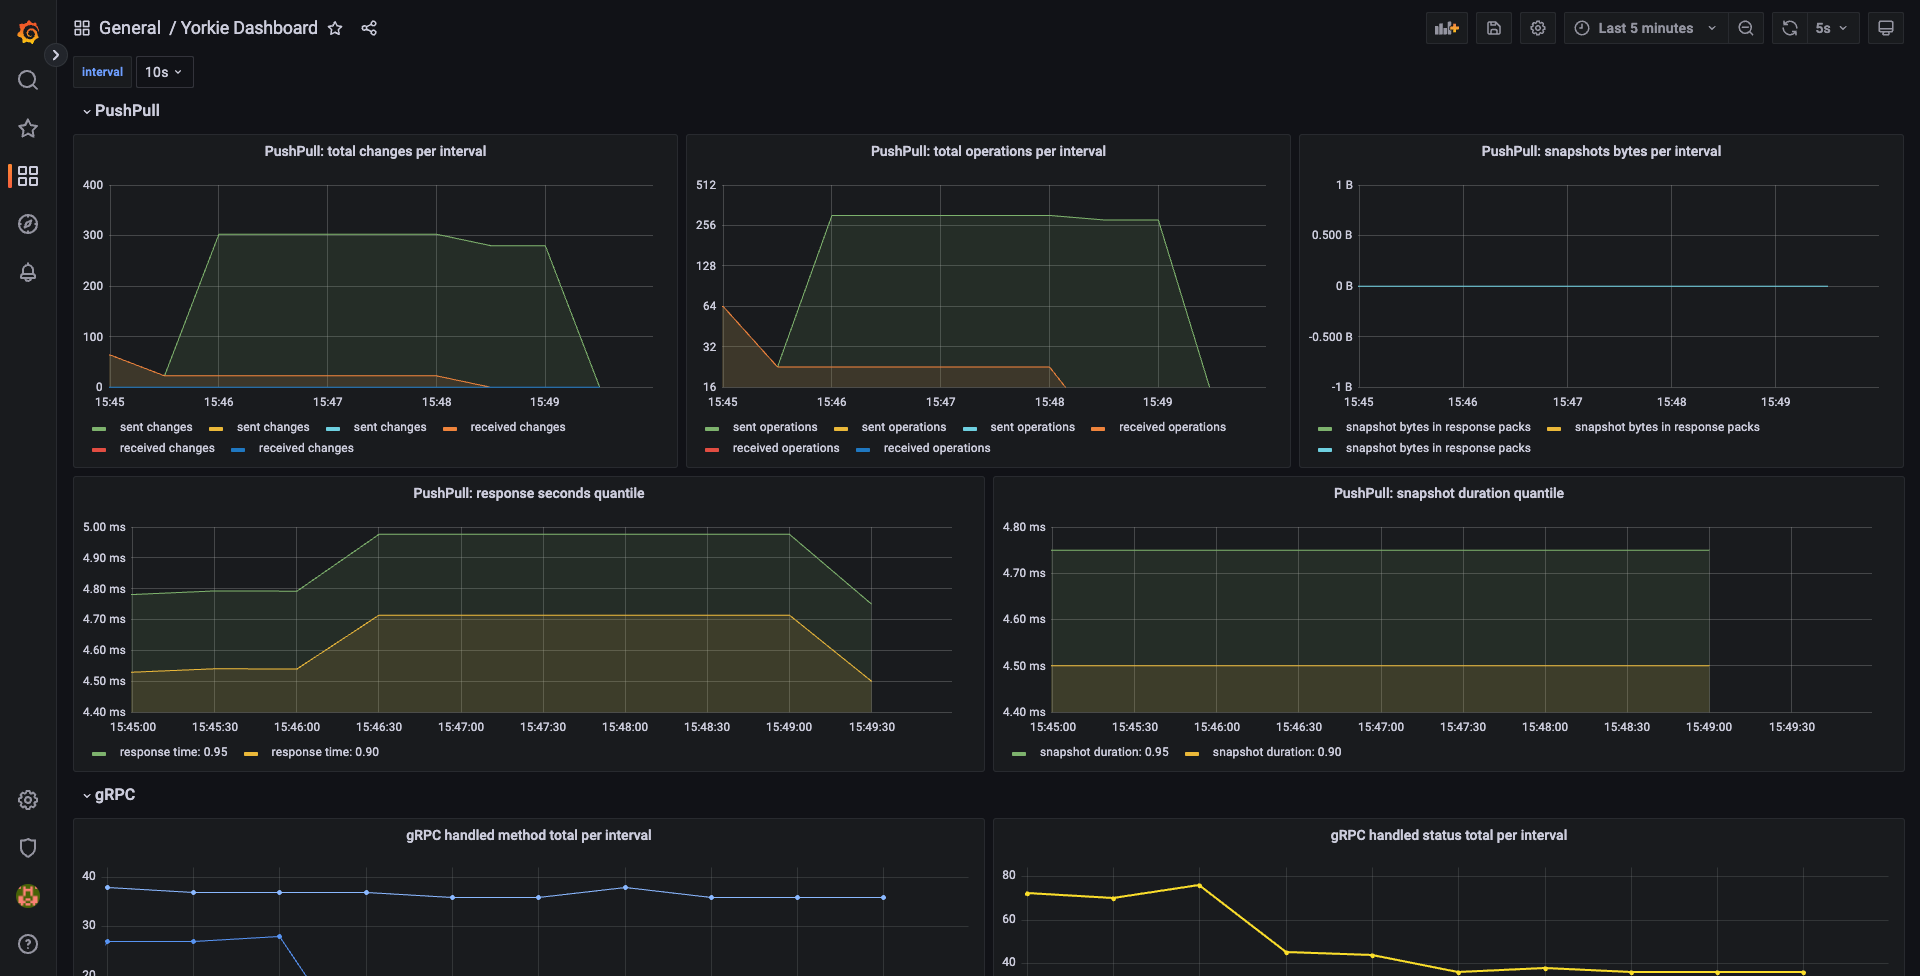
In Yorkie dashboard, you can view various metrics that Yorkie servers provide
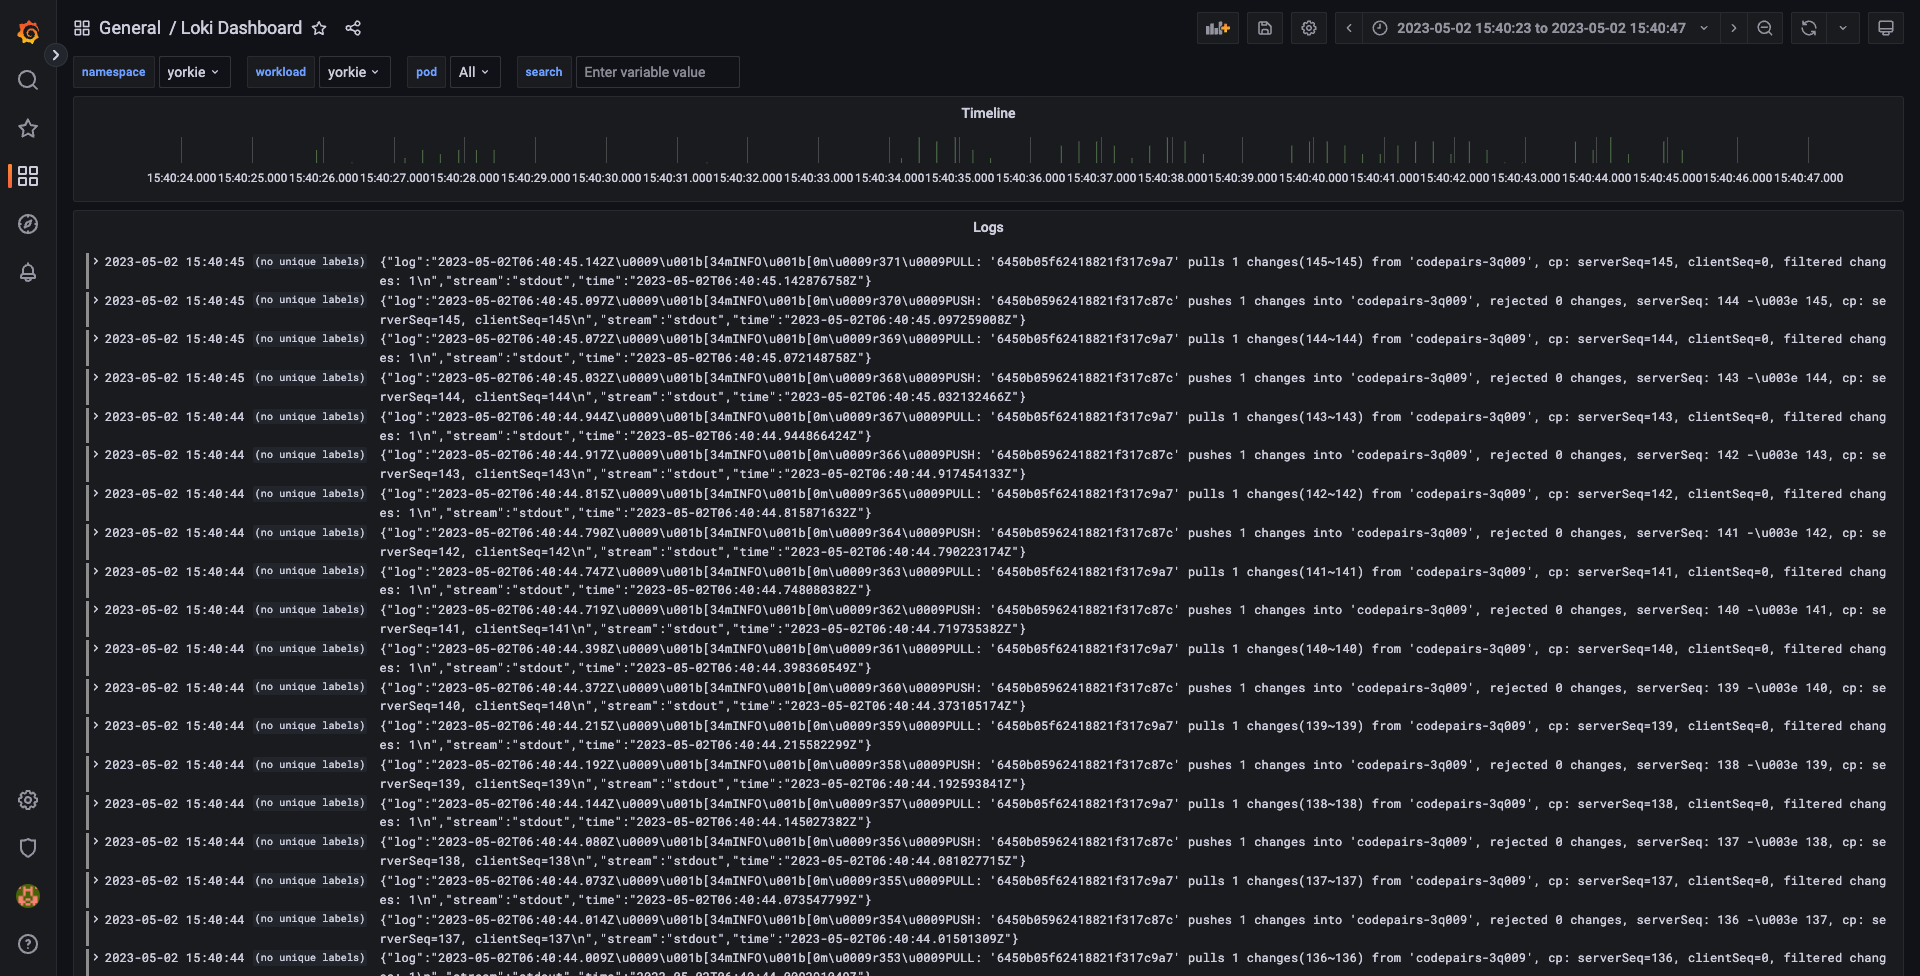
In Loki dashboard, you can view logs from Yorkie servers, as well as querying specific logs
namespace and workload to yorkie to see Yorkie logs in Loki dashboard.You can add more dashboards like Go Processes in Grafana dashboard.
Install ArgoCD with Helm chart
You can install ArgoCD to perform continuous delivery of Yorkie cluster with GitOps. We use the upstream argo/argo-cd Helm chart.
First, add the Argo Helm repository:
$ helm repo add argo https://argoproj.github.io/argo-helm$ helm repo update
Install ArgoCD with the following command:
$ helm install argo-cd argo/argo-cd -n argocd --create-namespace \--set crds.install=false \--set configs.params."server.insecure"=true \--set configs.params."server.rootpath"=/argocd
If you are using AWS EKS with ALB, add the ingress configuration:
$ helm install argo-cd argo/argo-cd -n argocd --create-namespace \--set crds.install=false \--set configs.params."server.insecure"=true \--set configs.params."server.rootpath"=/argocd \--set server.ingress.enabled=true \--set server.ingress.ingressClassName=alb \--set server.ingress.hostname={YOUR_API_DOMAIN_NAME} \--set server.ingress.path=/argocd/ \--set server.ingress.annotations."alb\.ingress\.kubernetes\.io/scheme"=internet-facing \--set server.ingress.annotations."alb\.ingress\.kubernetes\.io/certificate-arn"={YOUR_CERTIFICATE_ARN} \--set 'server.ingress.annotations.alb\.ingress\.kubernetes\.io/listen-ports=[{"HTTP": 80}\, {"HTTPS": 443}]'
Replace {YOUR_API_DOMAIN_NAME} with your domain name.
Also, replace {YOUR_CERTIFICATE_ARN} with your certificate ARN.
Then, install the ArgoCD Applications chart. This will be configured in a later section after all addons are installed.
$ helm install argocd-apps argo/argocd-apps -n argocd -f apps-values.yaml
You can get the initial admin password with the following command:
$ kubectl -n argocd get secret argocd-initial-admin-secret -o jsonpath="{.data.password}" | base64 -d
It will take a few minutes for pods to be ready, so wait until all pods are ready. You can check the status of pods with the following command:
$ kubectl get pods -n argocd --watch
After all pods are ready, you will see the following output:
NAME READY STATUS RESTARTS AGEargo-cd-argocd-application-controller-0 1/1 Running 0 2margo-cd-argocd-applicationset-controller-bffd78864-bcsfg 1/1 Running 0 2margo-cd-argocd-dex-server-55f8b67c89-d2j89 1/1 Running 0 2margo-cd-argocd-notifications-controller-59dd8dfbbb-5ps8w 1/1 Running 0 2margo-cd-argocd-redis-55bccb7655-kldsg 1/1 Running 0 2margo-cd-argocd-repo-server-79898bcb67-5nbfv 1/1 Running 0 2margo-cd-argocd-server-59696d4ccd-d2kjb 1/1 Running 0 2m
View Yorkie GitOps on ArgoCD web UI
Now you have ArgoCD installed, you can access ArgoCD web UI to view deployment status of Yorkie cluster.
Access ArgoCD web UI with following url:
- Minikube: http://
YOUR_MINIKUBE_IP/argocd/ - AWS EKS: http://
YOUR_API_DOMAIN_NAME/argocd/
admin and yorkie.Once you are logged in, you will see the following dashboard:
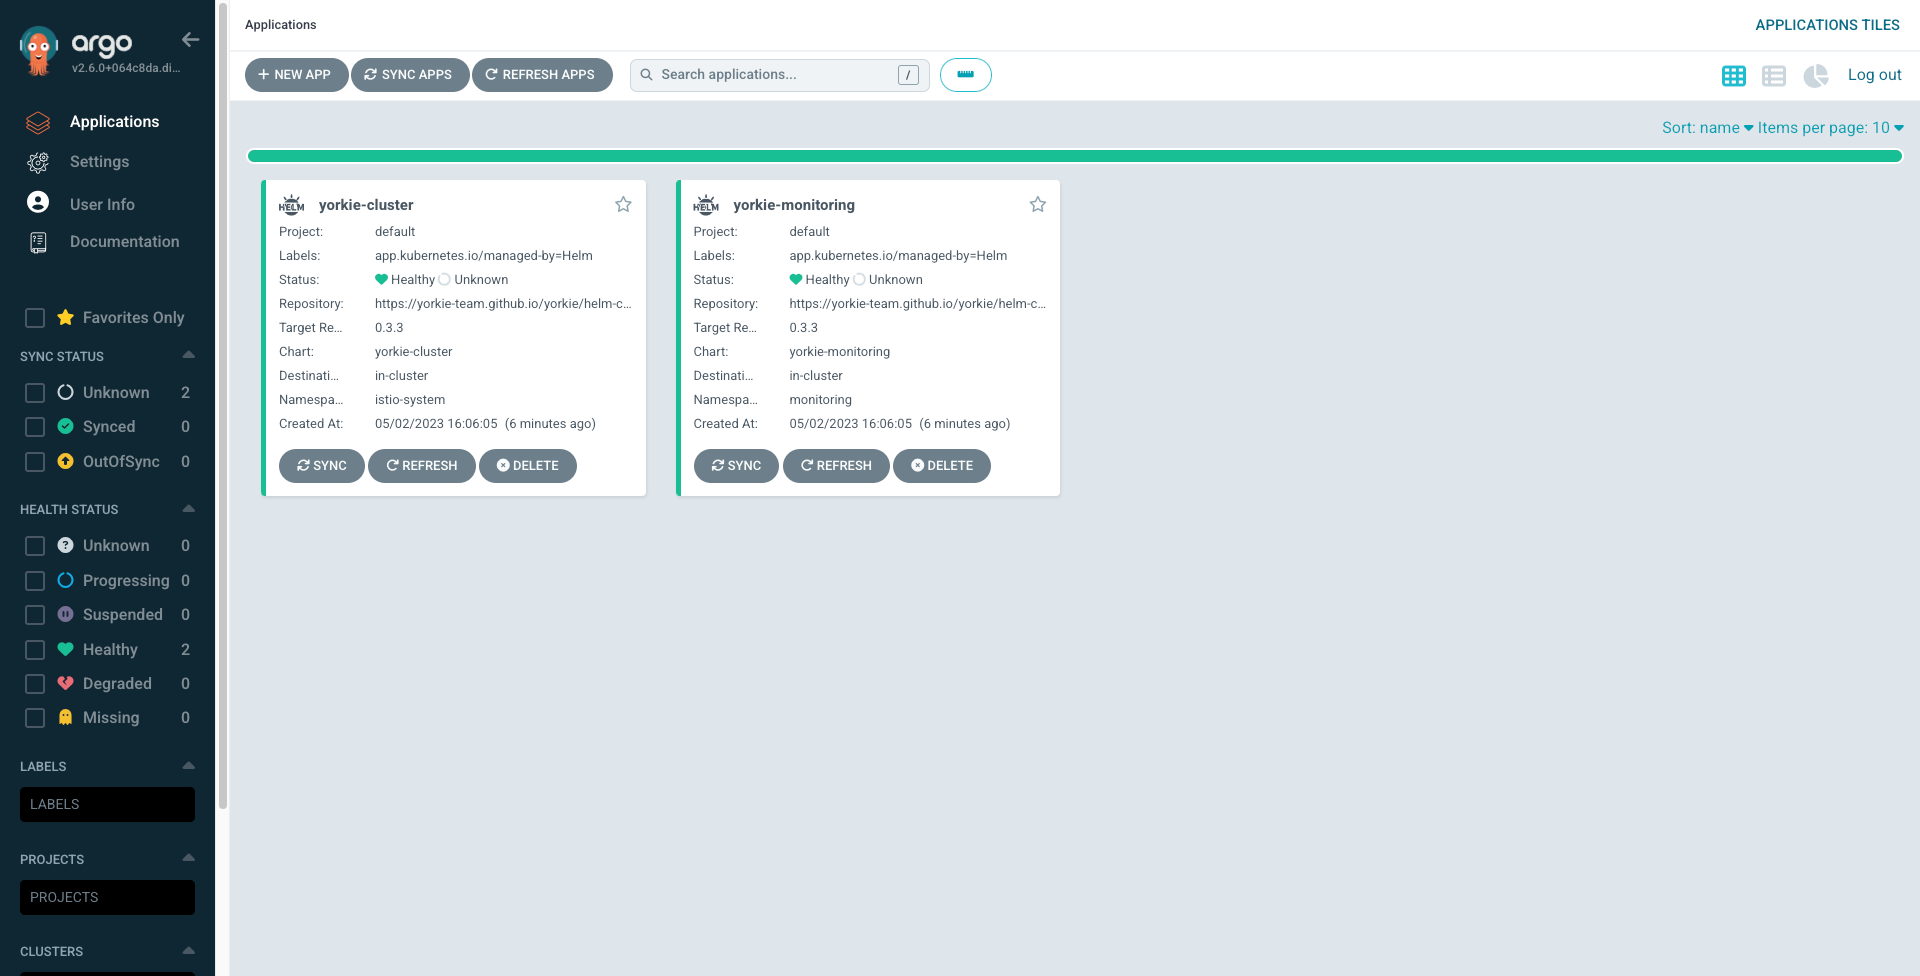
ArgoCD contains two default applications: Yorkie Cluster and Yorkie Monitoring
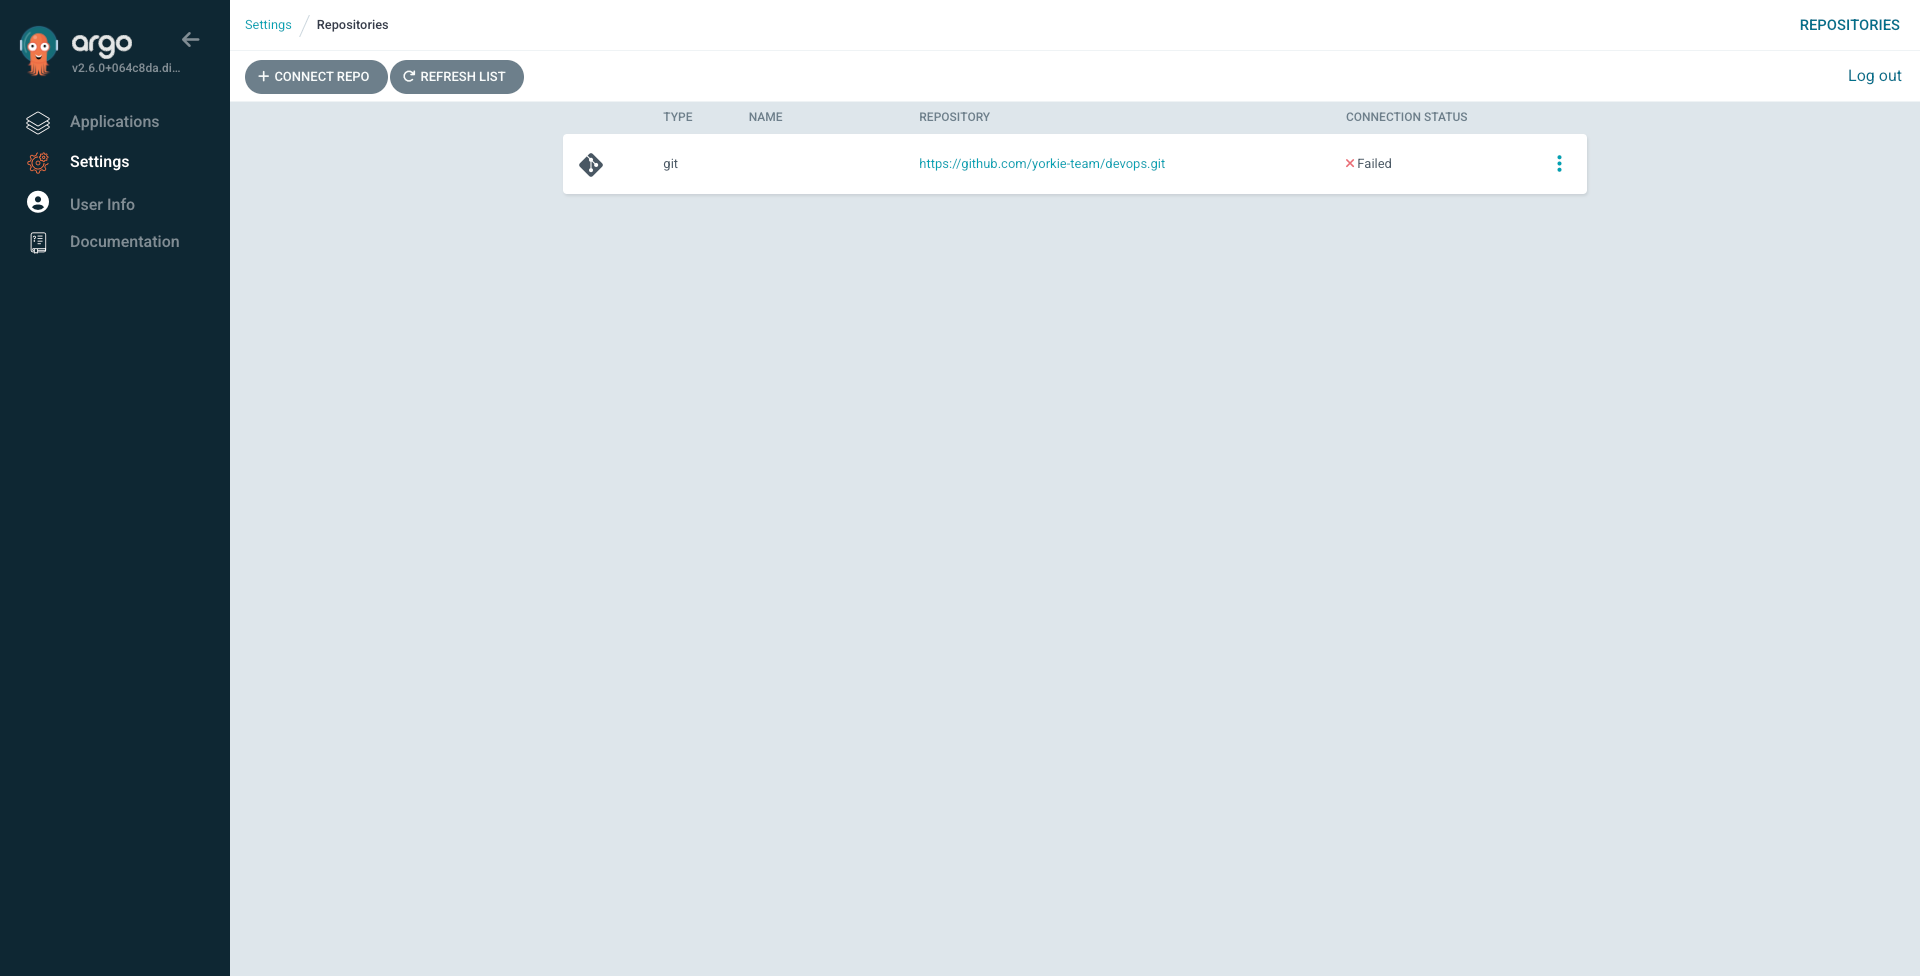
You need to set your own devops repository to use ArgoCD
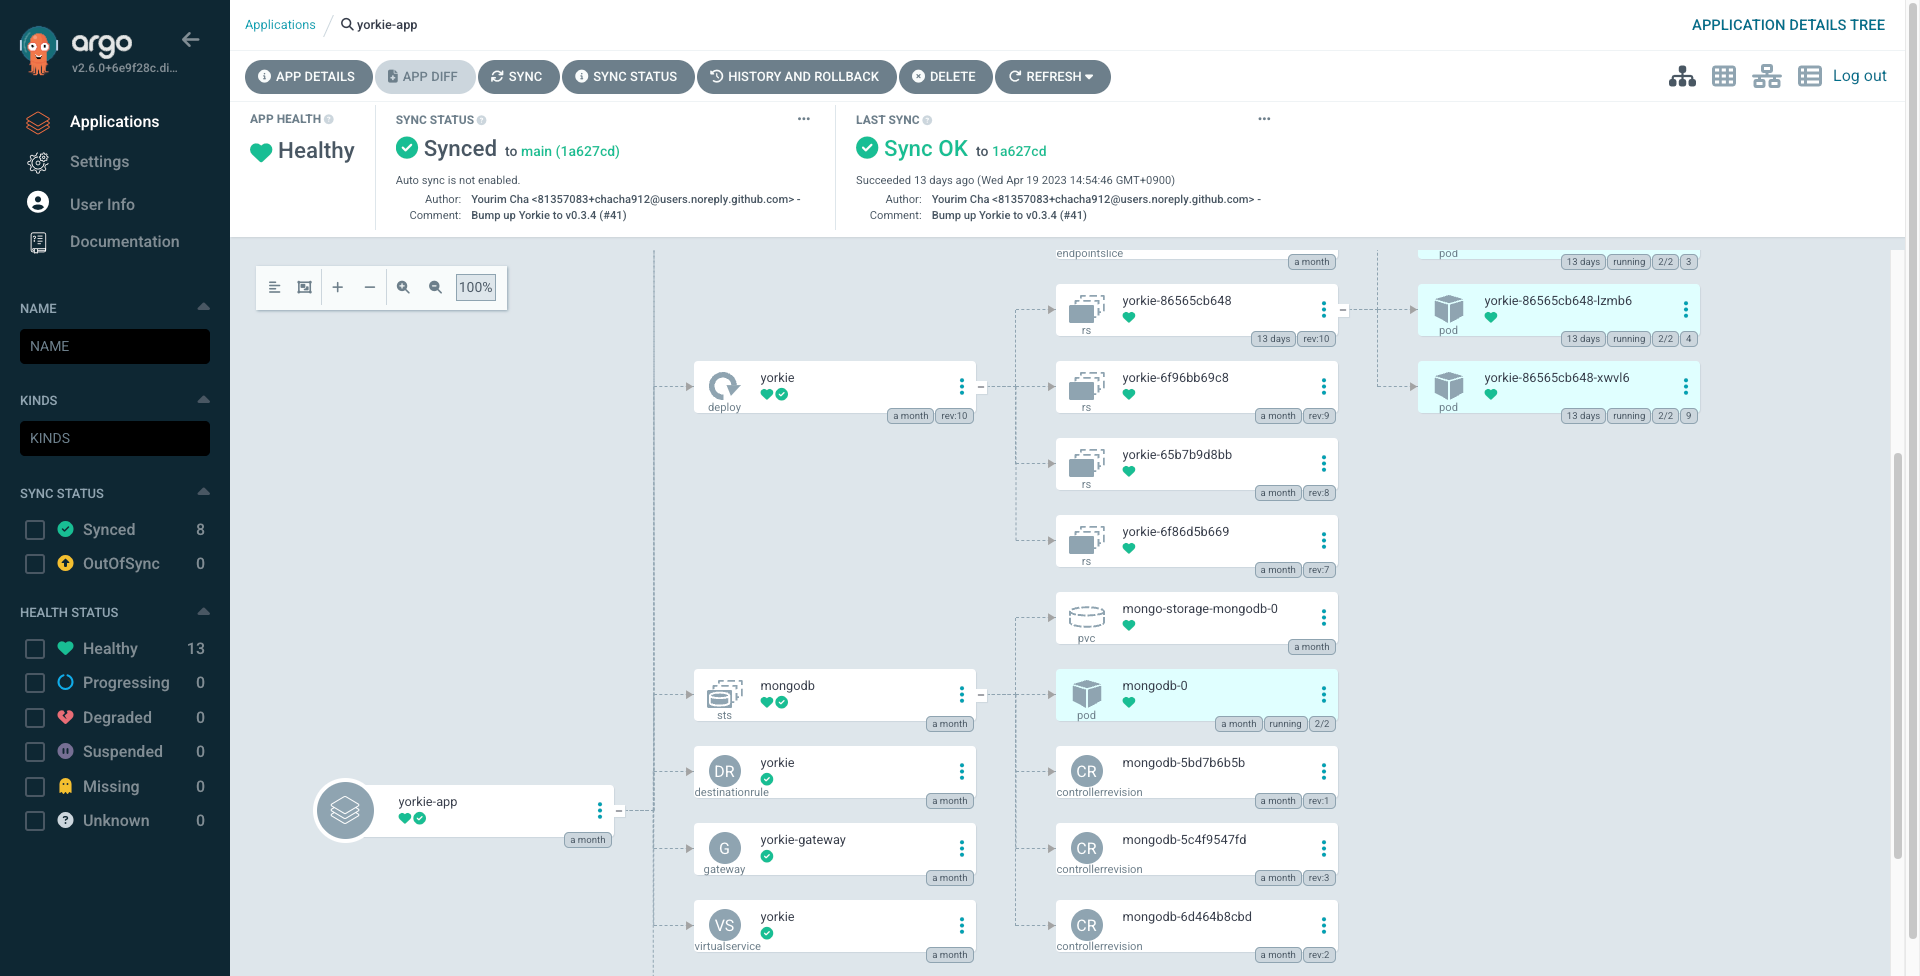
In Yorkie Cluster dashboard, you can view Yorkie cluster deployment status, as well as deploying Yorkie cluster
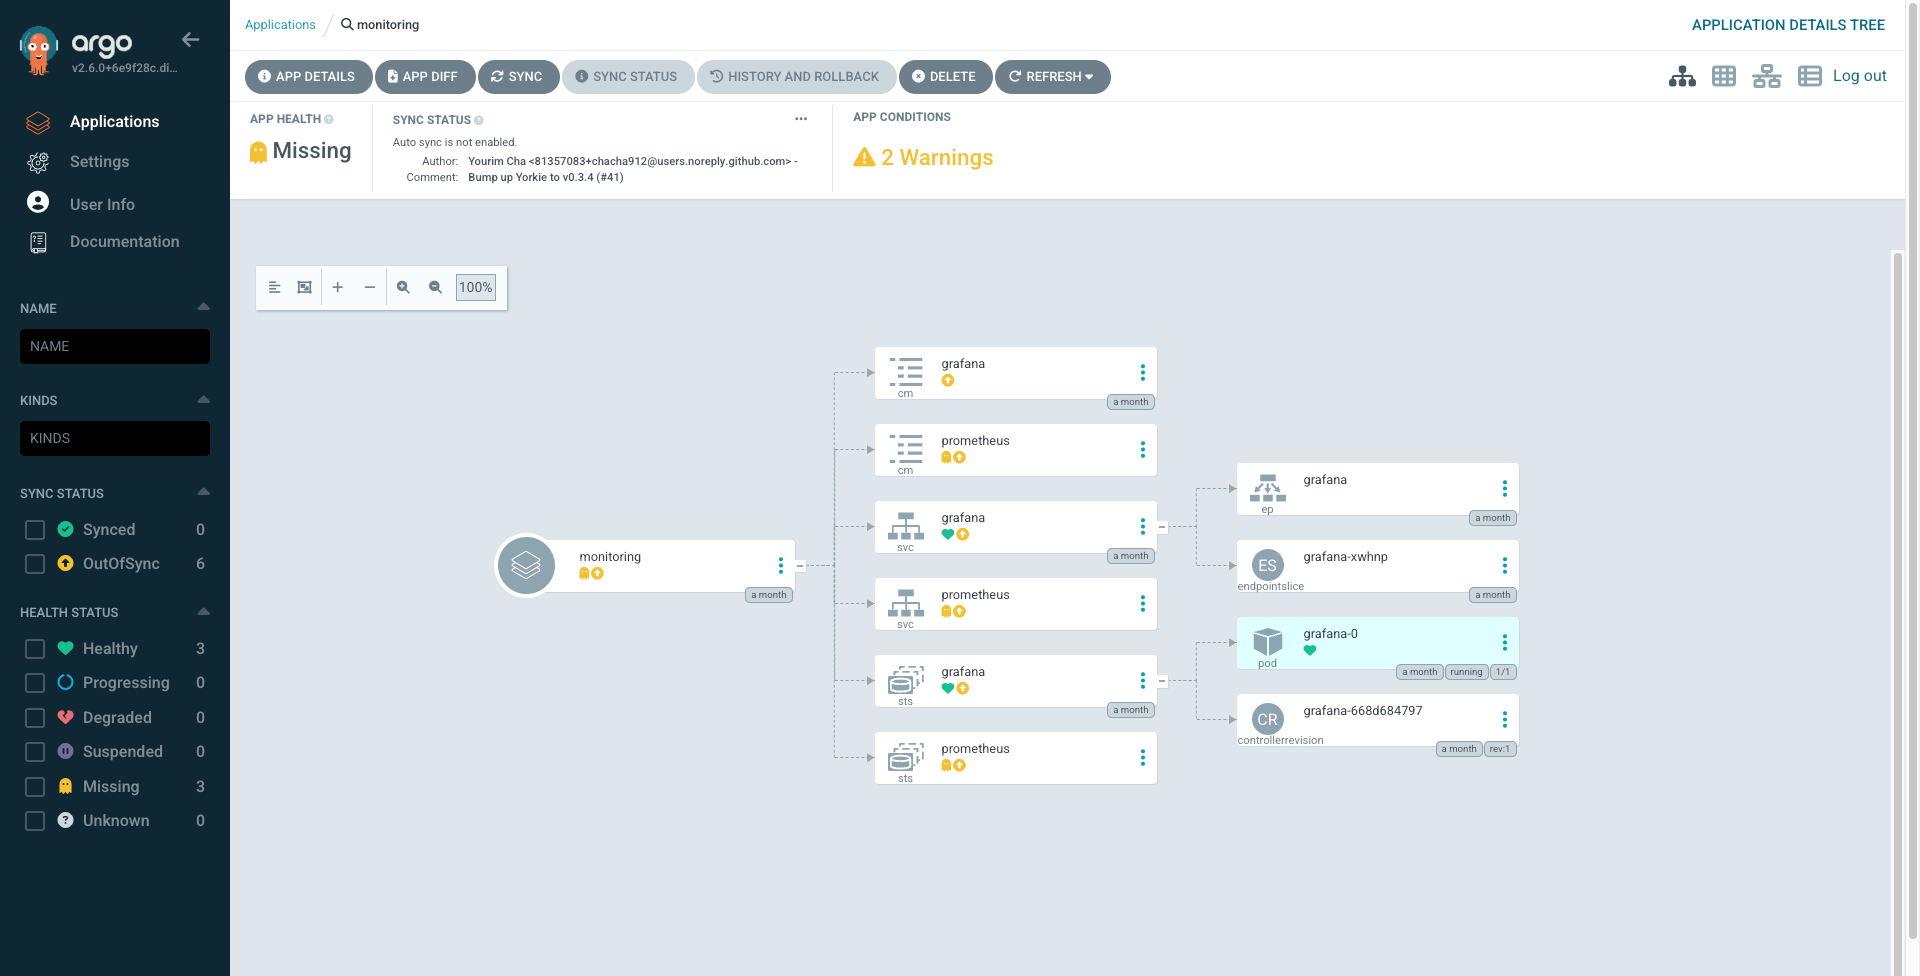
In Yorkie Monitoring dashboard, you can view Yorkie monitoring deployment status, as well as deploying Yorkie monitoring
Install Yorkie Analytics with Helm chart
You can install Yorkie analytics addon to enable analytics features. Yorkie analytics addon includes Kafka and StarRocks to perform analytics of usage of Yorkie cluster.
Install Yorkie analytics addon with the following command:
$ helm install yorkie-analytics yorkie-team/yorkie-analytics -n analytics --create-namespace
This will install yorkie-analytics release.
After Yorkie analytics is installed, you will see the following output:
NAME: yorkie-analyticsLAST DEPLOYED: Tue May 2 16:06:03 2023NAMESPACE: analyticsSTATUS: deployedREVISION: 1TEST SUITE: NoneNOTES:--- Install Complete ---yorkie-analytics successfully installed!For next steps, follow:$ curl https://github.com/yorkie-team/yorkie/tree/main/build/charts/yorkie-analyticsTo learn more about the release, try:$ helm status yorkie-analytics -n analytics$ helm get all yorkie-analytics -n analytics
It will take a few minutes for pods to be ready, so wait until all pods are ready. You can check the status of pods with the following command:
$ kubectl get pods -n analytics --watch
After all pods are ready, you will see the following output:
NAME READY STATUS RESTARTS AGEkube-starrocks-be-0 1/1 Running 0 2m53skube-starrocks-fe-0 1/1 Running 0 2m53skube-starrocks-operator-5898f6dc55-8m2fz 1/1 Running 0 2m53syorkie-analytics-init-kafka-topics-job-mhqlt 0/1 Completed 0 2m53syorkie-analytics-init-starrocks-database-job-8m5d2 0/1 Completed 0 2m53syorkie-analytics-kafka-controller-0 1/1 Running 0 2m53s
To access StarRocks MySQL client, you can use the following command:
$ kubectl exec -it pod/kube-starrocks-fe-0 -n analytics -- mysql -P9030 -h127.0.0.1 -u root --prompt="StarRocks >"StarRocks > use yorkie;StarRocks > show routine load\G
Then you can see the following output with the running routine load:
*************************** 1. row ***************************Id: 11063Name: user_eventsCreateTime: 2025-04-09 16:49:58PauseTime: NULLEndTime: NULLDbName: yorkieTableName: user_eventsState: RUNNINGDataSourceType: KAFKACurrentTaskNum: 1JobProperties: {"partitions":"*","partial_update":"false","columnToColumnExpr":"*","maxBatchIntervalS":"10","partial_update_mode":"null","whereExpr":"*","dataFormat":"json","timezone":"Asia/Shanghai","format":"json","log_rejected_record_num":"0","taskTimeoutSecond":"60","json_root":"","pause_on_fatal_parse_error":"false","maxFilterRatio":"1.0","strict_mode":"false","jsonpaths":"","taskConsumeSecond":"15","desireTaskConcurrentNum":"1","maxErrorNum":"0","strip_outer_array":"false","currentTaskConcurrentNum":"1","maxBatchRows":"200000"}DataSourceProperties: {"topic":"user-events","currentKafkaPartitions":"0","brokerList":"yorkie-analytics-kafka.analytics.svc.cluster.local:9092"}CustomProperties: {"group.id":"user_events_group"}Statistic: {"receivedBytes":28999,"errorRows":0,"committedTaskNum":106,"loadedRows":154,"loadRowsRate":2,"abortedTaskNum":0,"totalRows":154,"unselectedRows":0,"receivedBytesRate":521,"taskExecuteTimeMs":55554}Progress: {"0":"158"}TimestampProgress: {"0":"1744627675913"}ReasonOfStateChanged:ErrorLogUrls:TrackingSQL:OtherMsg: [2025-04-14 19:51:31] [task id: 61ac06c9-2892-419b-800a-153b9b9f8ad3] [txn id: -1] there is no new data in kafka, wait for 10 seconds to schedule againLatestSourcePosition: {"0":"159"}OffsetLag: {"0":"1"}*************************** 2. row ***************************...
Connect Yorkie cluster to Yorkie analytics
Now you have Yorkie analytics installed, you can connect Yorkie cluster to Yorkie analytics. You need to set up the following arguments in your Yorkie cluster:
helm upgrade yorkie-cluster yorkie-team/yorkie-cluster --namespace yorkie \--set yorkie.args.kafkaAddresses=yorkie-analytics-kafka.analytics.svc.cluster.local:9092 \--set yorkie.args.kafkaWriteTimeout=5s \--set yorkie.args.starrocksDSN="root:@tcp(kube-starrocks-fe-search.analytics.svc.cluster.local:9030)/yorkie"
If clients are connected to Yorkie cluster with userID(Measuring MAU), you can see the user events are collected in StarRocks database.
StarRocks > use yorkie;StarRocks > select * from user_events;
Then you will see the following output:
+--------------------------+----------------------------+------------------+--------------------------+----------------------------+| user_id | timestamp | event_type | project_id | user_agent |+--------------------------+----------------------------+------------------+--------------------------+----------------------------+| XXX | 2025-04-14 04:57:26.494445 | client-activated | 67f150814b8be3e231395358 | @yorkie-js/sdk/0.6.6 |+--------------------------+----------------------------+------------------+--------------------------+----------------------------+1 rows in set (0.01 sec)
Yorkie analytics collects various information beyond MAU measurement, including client connections, document operations, and other usage metrics on the Dashboard.
Connect Yorkie addons to ArgoCD
Now that all addons are installed, you can connect them to ArgoCD for GitOps-based continuous delivery.
Create an apps-values.yaml file that defines ArgoCD Applications for each Yorkie addon:
# apps-values.yamlapplications:yorkie-cluster:namespace: argocdproject: defaultsources:- repoURL: https://yorkie-team.github.io/yorkie/helm-chartschart: yorkie-clustertargetRevision: 0.7.8helm:valueFiles:- $values/k8s/cluster/values.yaml- repoURL: https://github.com/your-org/your-devops-repo.gittargetRevision: mainref: valuesdestination:server: https://kubernetes.default.svcnamespace: yorkieyorkie-monitoring:namespace: argocdproject: defaultsources:- repoURL: https://yorkie-team.github.io/yorkie/helm-chartschart: yorkie-monitoringtargetRevision: 0.7.8helm:valueFiles:- $values/k8s/monitoring/values.yaml- repoURL: https://github.com/your-org/your-devops-repo.gittargetRevision: mainref: valuesdestination:server: https://kubernetes.default.svcnamespace: monitoringyorkie-analytics:namespace: argocdproject: defaultsource:repoURL: https://yorkie-team.github.io/yorkie/helm-chartschart: yorkie-analyticstargetRevision: 0.7.8destination:server: https://kubernetes.default.svcnamespace: analytics
Replace your-org/your-devops-repo with your GitOps repository that contains the Helm values files.
Install the Applications chart:
$ helm install argocd-apps argo/argocd-apps -n argocd -f apps-values.yaml
After the Applications are created, ArgoCD will detect and manage the Yorkie addons. You can view and sync them from the ArgoCD web UI.
Clean up cluster addons
You have now installed Yorkie monitoring and ArgoCD, and viewed Yorkie metrics on Grafana dashboard and Yorkie GitOps on ArgoCD web UI.
To learn about how to configure Yorkie Monitoring in Helm Chart, see Yorkie Chart Repository. For ArgoCD configuration, see argo-cd chart documentation.
First, uninstall ArgoCD with the following command:
# Uninstall ArgoCD helm chart releases$ helm uninstall argocd-apps -n argocd$ helm uninstall argo-cd -n argocd# Delete ArgoCD CRDs$ kubectl get crd -oname | grep --color=never 'argoproj.io' | xargs kubectl delete# (Optional) Delete ArgoCD namespace$ kubectl delete namespace argocd
Then, uninstall Yorkie monitoring with the following command:
# Uninstall Yorkie monitoring helm chart release$ helm uninstall yorkie-monitoring -n monitoring# Delete monitoring CRDs$ kubectl get crd -oname | grep --color=never 'monitoring.coreos.com' | xargs kubectl delete# Delete monitoring service accounts$ kubectl delete serviceaccounts --all -n monitoring# (Optional) Delete monitoring namespace$ kubectl delete namespace monitoring
Then, uninstall Yorkie analytics with the following command:
# Uninstall Yorkie analytics helm chart release$ helm uninstall yorkie-analytics -n analytics$ kubectl delete namespace analytics
Next Steps
For more information about Yorkie cluster design, follow: Yorkie Cluster Design